Masthead 2021
Convergence is published yearly by the Department of Mathematical Sciences at Carnegie Mellon University for its students, alumni and friends to inform them about the department and serve as a channel of communication for our community. Readers with comments or questions are urged to send them to Convergence. The department is headed by Prasad Tetali.
Editor-in-Chief
Prasad Tetali, Department Head
Editor
Jocelyn Duffy, Associate Dean for Communications
Design & Layout
Matthew Salyers, Communications Manager
Contributing Writers
Jocelyn Duffy, Ben Panko, Emily Payne, Steve Shreve, Elizabeth Speed, Colleen Storm
Publications Managers
Emily Payne, Rachel Keeney
Photography & Images
Jonah Bayer, Digital Producer
Courtesy of Carnegie Mellon University, unless otherwise noted
Online Magazine
Gigi Wiltanger, Web Manager
Carnegie Mellon University
Department of Mathematical Sciences
Wean Hall 6113
Pittsburgh, PA 15213
Carnegie Mellon University does not discriminate in admission, employment, or administration of its programs or activities on the basis of race, color, national origin, sex, handicap or disability, age, sexual orientation, gender identity, religion, creed, ancestry, belief, veteran status, or genetic information. Furthermore, Carnegie Mellon University does not discriminate and is required not to discriminate in violation of federal, state, or local laws or executive orders.
Inquiries concerning the application of and compliance with this statement should be directed to the university ombudsman, Carnegie Mellon University, 5000 Forbes Avenue, Pittsburgh, PA 15213, telephone 412-268-1018.
Obtain general information about Carnegie Mellon University by calling 412-268-2000
Produced for the Department of Mathematical Sciences by Marketing & Communications, November, 2018, 19-150.
©2018 Carnegie Mellon University, All rights reserved. No part of this publication may be reproduced in any form without written permission from Carnegie Mellon University’s Department of Mathematical Sciences.
About the Cover
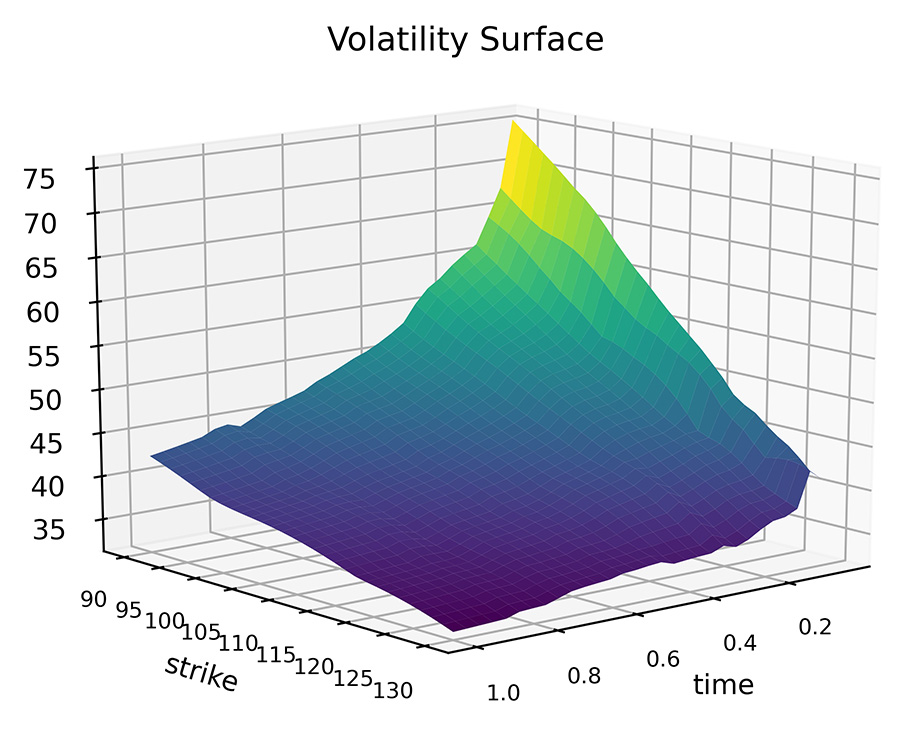
The graph shows the volatility in percent on the vertical axis for IBM stock computed from the prices of options with differing strike prices and times to expiration using Dupire’s formula.
Image generated by MathFinance AG based on data sources from Bloomberg for IBM volatilities of April 6, 2020.

